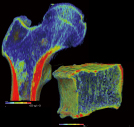
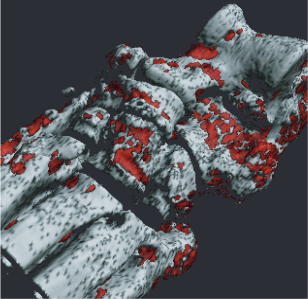
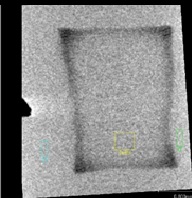
3D Bone BMD measurement
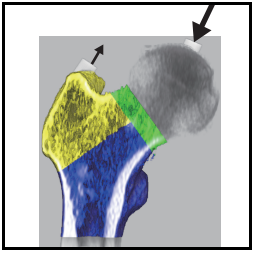
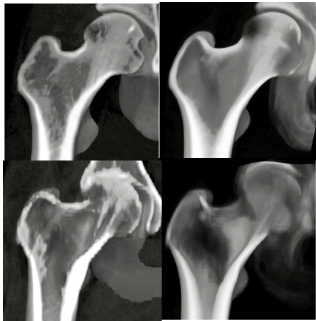
Femur measurement
Waist, chest, cervical spine
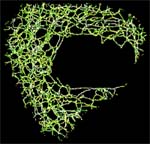
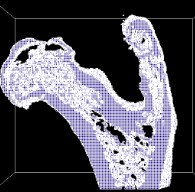
bone morphometry
Bone mineral density measurement
Rheumatism measurement
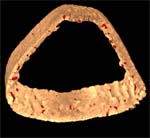
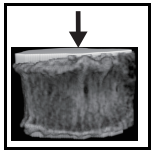
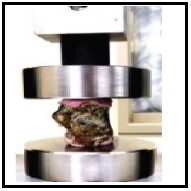
Cortical bone measurement
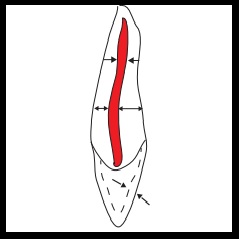
Tooth 3D morphological detail measurement
Medication measurement software using the VBMmethod
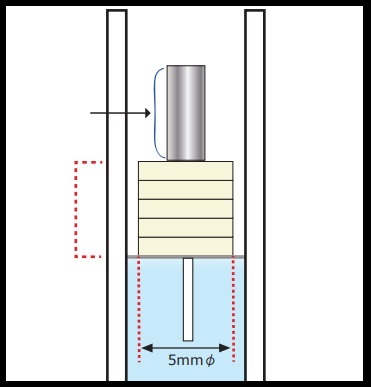
Measurement of enamel mineral loss
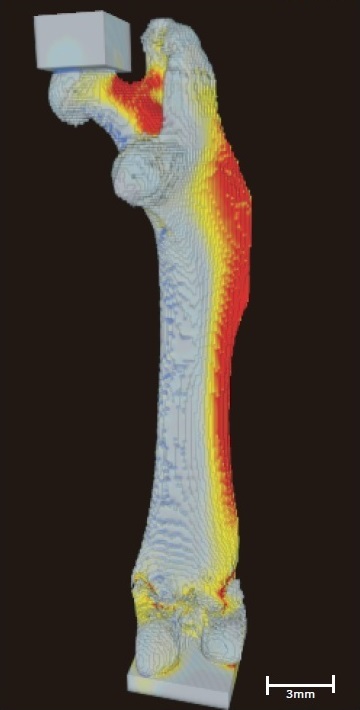
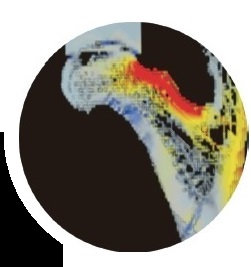
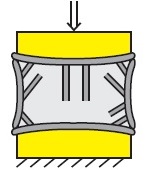
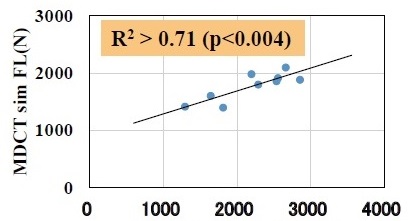
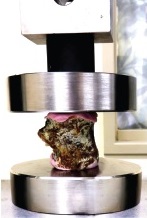
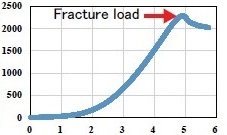
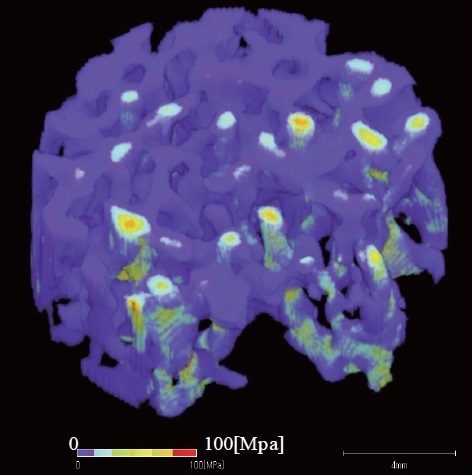
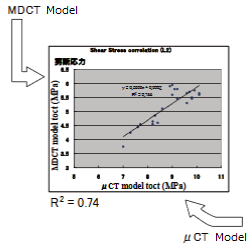
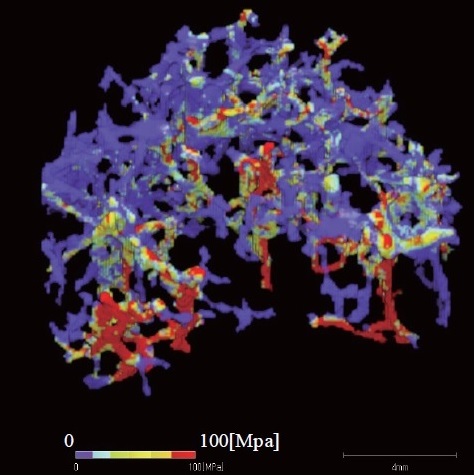
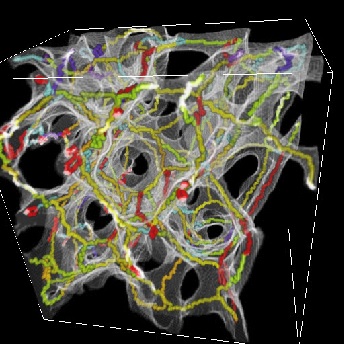
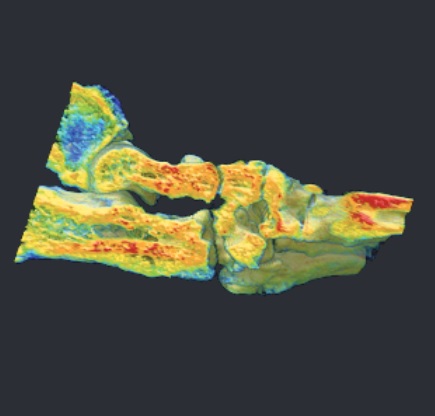
Finite element analysis
Bone Mineral Phantom